

About this template
Product Profitability Analysis & Product Mix 2026/2027
A complete template package for companies that want to understand which products, services, or product groups are actually driving profitability – and which are tying up capital, have weak margins, or should be prioritized for action.
The package combines a professional Swedish master template, an English reference version, separate user guides, and an advanced Excel tool for up to 200 products. The analysis helps you distinguish between high turnover, high margin, large total contribution margin, and strategic value.
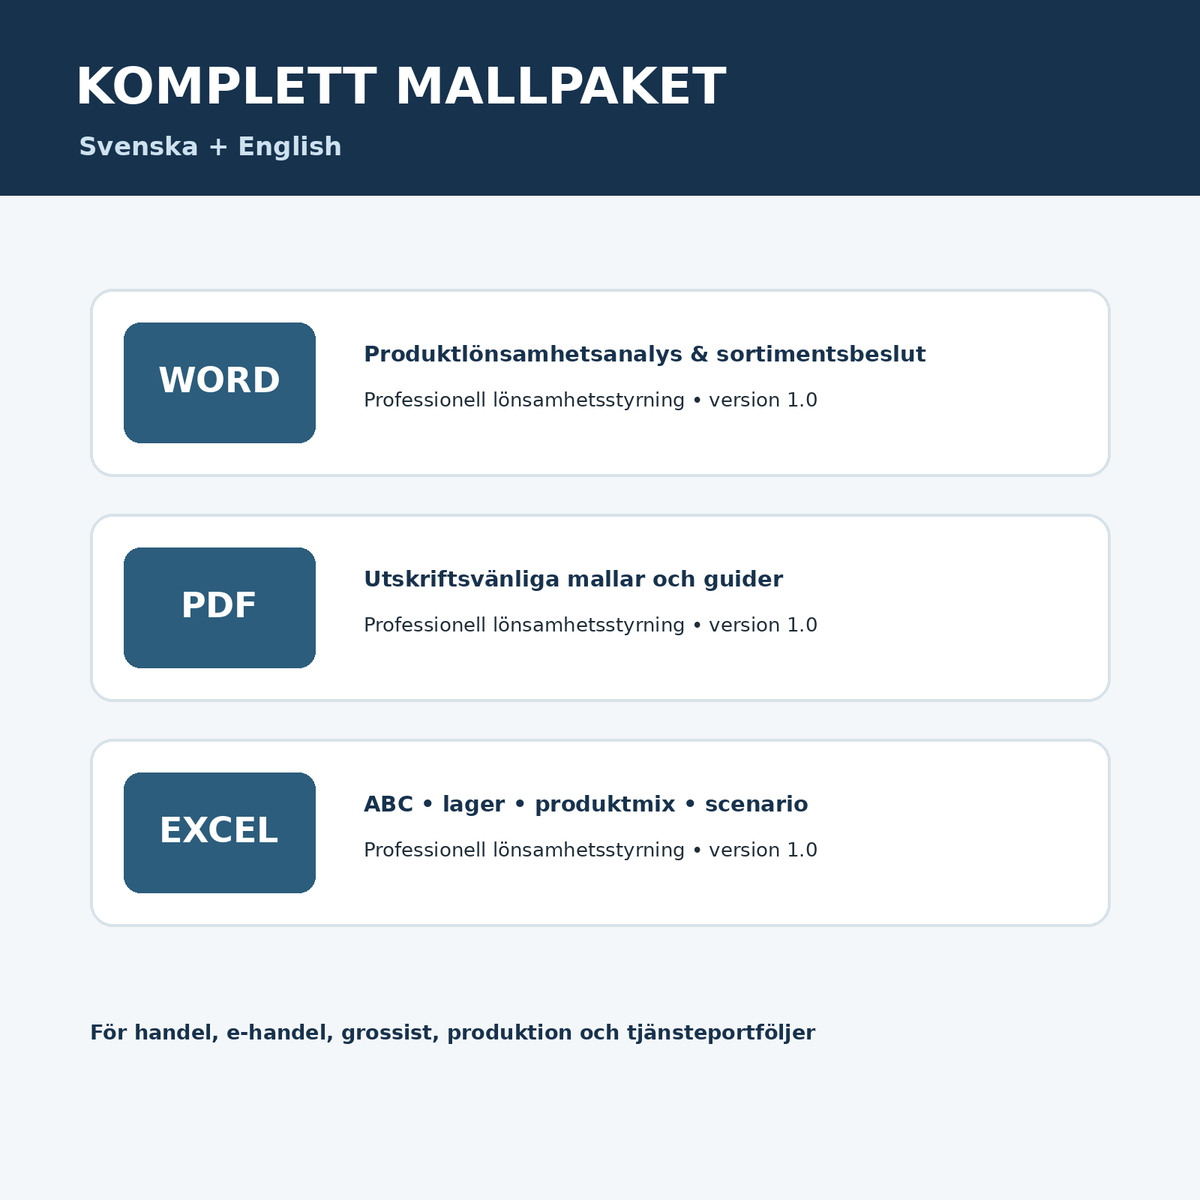
Included in this package
- Swedish product profitability analysis in Word and PDF.
- English Product Profitability & Product Mix in Word and PDF.
- Swedish user guide in Word and PDF.
- English User Guide in Word and PDF.
- Excel model with dashboard, ABC analysis, product mix signals, inventory analysis, category summary, scenarios, and action register.
Analyze margin and contribution margin
The Excel tool automatically calculates the average price per unit, total direct cost, contribution margin per unit, contribution margin ratio, total contribution margin, and profit after any allocated shared costs. This makes it easier to see the difference between a product that sells a lot and a product that actually contributes financially.
ABC classification
Products can be classified into A, B, and C based on their cumulative share of total contribution margin or turnover. The default setting uses total contribution margin. The A and B limits are user-controlled, making the model flexible for different product ranges and businesses.
Product mix signal
Each product receives an automatic signal that can, for example, identify negative contributions, high turnover with low margins, low turnover with good margins, or slow inventory turnover. The signal is a decision-support tool – not an automatic decision – and should always be combined with strategic judgment.
Inventory and capital tie-up
For stocked products, you can register the average inventory value. The model then calculates inventory turnover rate and days of inventory. This provides a better basis for weighing margins against capital tie-up, demand, and the risk of slow inventory turnover or obsolescence.
Scenario analysis
The scenario tab shows how the turnover and contribution margin of the entire product portfolio are affected by, for example, price changes, volume changes, or higher direct costs. This makes the model useful for price adjustments, supplier negotiations, and product assortment decisions.
Suitable for, among others
- retail and e-commerce,
- wholesale and distribution,
- production and manufacturing,
- service companies with multiple offerings or packages,
- product managers, financial controllers, and business leaders.
Important regarding cost allocation
Product profitability is an internal management metric. Shared fixed costs should only be allocated when there is a relevant and documented allocation key. The template therefore distinguishes between contribution margin before shared costs and profit after any allocation.
Reviewed 2026/2027
Structure, calculation logic, and guidance were reviewed on October 8, 2026. The product package is developed as a practical decision-support tool and does not replace the company's bookkeeping, annual report, or individual financial advice.