

About this template
OEE & TAK – Machine Efficiency 2026/2027 is a practical document package for production managers, manufacturing companies, machine operators, and quality managers who want to analyze how planned production time is used. You receive a professional OEE calculator in Excel with a shift register, downtime log, machine register, action follow-up, and a clear dashboard. In addition, editable Word templates and printable PDFs are included for shift reports, measurement routines, and user instructions.
SEK 79, one-time purchase. No recurring fees. The tool works offline in compatible software but is not machine-integrated, an MES system, or an automatic alarm and safety system.
Version 1.0 – for 2026/2027. The calculation principles have been verified against public OEE guides and the Swedish explanation of the TAK method. The templates are general work tools, not a certified measurement solution or an assessment of machine safety. ISO standard texts or claimed ISO certification are not included.
What is included in the package
| Document or tool | Content | Format |
|---|---|---|
| OEE/TAK – measurement routine | Definitions, scope, responsibilities, measurement method, control points, and version control. | Word + PDF |
| Shift log & downtime | Shift ID, time data, production volumes, causes of stoppages, calculation verification, and decided improvements. | Word + PDF |
| Separate user guide | Step-by-step instructions for all Excel sheets, a realistic calculation example, data quality, pitfalls, checklist, and sources. | Word + PDF |
| OEE – Shift Working Sheet (English) | Supplementary English shift worksheet for staff in Swedish operations – not a complete translation of all documents. | Word + PDF |
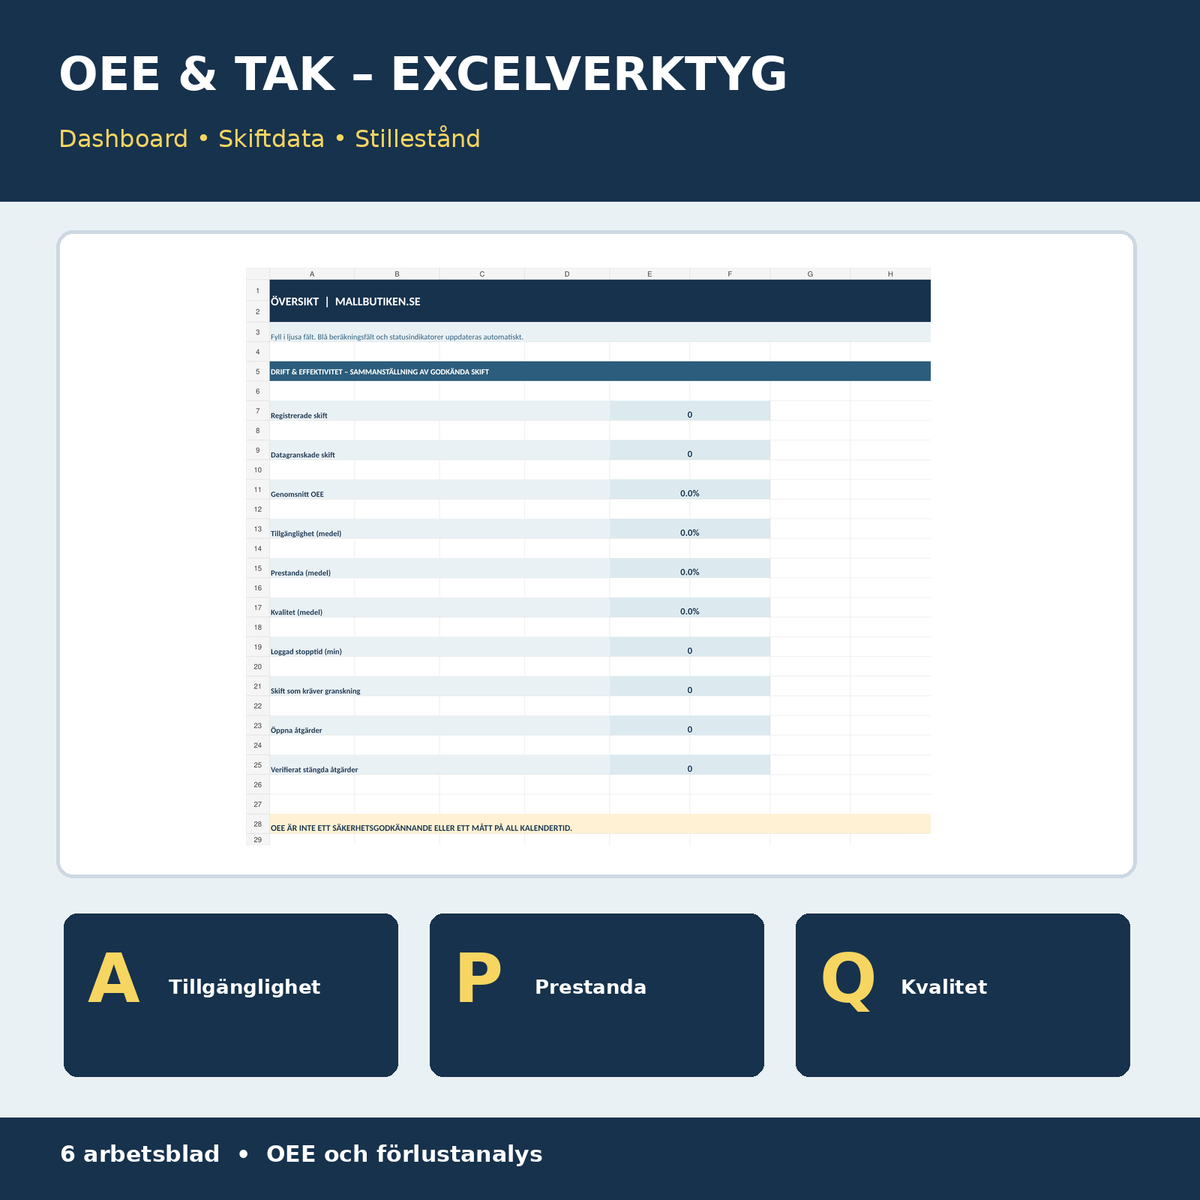
| OEE & TAK in Excel | Six sheets for machines, shift data, downtime, actions, instructions, and a dashboard with calculated KPIs. | Excel (XLSX) |
Total of nine files: four Word (DOCX), four searchable A4-PDFs, and one Excel (XLSX), gathered in a ZIP file. Swedish is the primary language with an English working template as a supplement.
Who is the OEE template for?
The template is particularly useful for small and medium-sized industrial companies, CNC workshops, manufacturing operations, production managers, and quality teams who need to track recurring stoppages, pace deficiencies, and scrap rates across different shifts. It can be used both for the initial implementation of a simpler TAK workflow and as an additional analysis base for existing production follow-up.
How do you calculate OEE/TAK?
OEE = Availability × Performance × Quality. The three factors must be calculated from the same machine and time period:
- Availability (A) = (planned production time − downtime) / planned production time.
- Performance (P) = (verified ideal time in seconds/unit × total produced quantity) / (operating time in minutes × 60).
- Quality (Q) = (total produced quantity − scrapped units) / total produced quantity.
Calculation example: Planned production time 420 minutes, downtime 42 minutes, ideal time 30 seconds per unit, and 680 units produced, of which 20 are scrapped. Availability becomes 90.0%, performance approximately 89.95%, quality approximately 97.06%, and OEE approximately 78.57%. In Excel, the calculation is performed automatically once the necessary information has been entered and the downtime follow-up has been approved.
The Excel tool – six interconnected worksheets
| Sheet | Practical function |
|---|---|
| Overview | Number of shifts, reviewed shifts, average OEE and its sub-factors, summed downtime minutes, data warnings, and open actions. |
| Machines | 50 rows for machine ID, name, process, responsible person, and reference to ideal time. |
| Shift data | 120 rows with planned time, ideal time, volumes, scrap, and automatic OEE formula, plus data status check. |
| Downtime | 180 rows for stop ID, shift ID, machine, cause, stop time, and performed action. Stop time is automatically summed to the matching shift. |
| Actions | 100 improvement issues with loss category, responsible person, target date, status, effect check, and evidence reference. |
| Instructions | Definitions, correct time units, step-by-step usage, method limitations, and source references. |
Excel uses a unique Shift ID to link shifts and downtime together. For example, you register a shift with ID SK-2026-0001 and use the same ID for all stoppages within that shift. Once you have checked the downtime log, mark it as reviewed. Calculations only begin when there is sufficiently reliable data.
Please note: The dashboard average consists of simple averages over shifts with approved data status, not a separately weighted total OEE for an entire factory. An incomplete shift will not receive a final OEE value. For comparisons, you must use a consistent definition of downtime, ideal time, and approved output.
How to get started – step by step
- Determine the method: select the relevant machine, product, reporting period, and a consistent definition of planned production time.
- Verify ideal time: use a realistic and documented cycle time in seconds per unit for the correct process.
- Create machine and shift IDs: use the same designation in all registers.
- Enter real shift data: minutes, total production, and scrap.
- Register downtime: enter stop causes and stop time in the separate log with the correct Shift ID.
- Review data: confirm the downtime log and check the data status before drawing conclusions.
- Identify main loss: compare availability, performance, and quality with previous, comparable periods.
- Follow up on improvements: document the action, responsibility, deadline, and actual measured effect.
Common pitfalls
- Mixing minutes and seconds in the pace and time data.
- Excluding changeover time in some shifts but including it in others.
- Registering the same downtime multiple times.
- Counting reworked units as approved without a documented and consistent definition.
- Treating high OEE as proof of safe operation, sufficient staffing, or high economic profitability.
- Stating an improvement as verified without new measurement data.
OEE and legal or technical requirements
OEE/TAK is a method for production follow-up – not a general statutory KPI for all Swedish companies. The ISO 22400 series can provide support for terminology and KPIs in production, but protected standard text is not included here. The calculator does not replace work environment risk assessments, machine safety requirements, product control, certification, or industry-specific obligations.
Frequently asked questions
What are OEE and TAK?
Overall Equipment Effectiveness, often called TAK in Swedish operations, is a combined measure of availability, performance, and quality during defined production time.
Is an OEE calculator in Excel better than a full MES system?
They are different solutions. This product is affordable and stand-alone for manual follow-up, but it does not automatically collect data from machines and does not include real-time monitoring or advanced production control.
What do I do if my OEE is displayed as empty?
Check if the Shift ID, planned time, ideal time, volumes, scrap, and downtime log are complete, and if the downtime log is marked as reviewed. Also, check if an incorrect cycle time value has been flagged.
Is downtime analysis included?
Yes. A separate log can register multiple stops per shift and compile stop time into the shift calculation. Cause and action can be documented separately.
Can the tool be used for different machines?
Yes. The machine register has space for 50 machines and the shift register for 120 shifts. The exact same measurement definitions should be used when comparing results.
Are there English files available?
Yes, an English shift worksheet is included as a supplement for Swedish operations. The main documents and the user guide are in Swedish.
Are the PDF files editable forms?
The Word documents are editable. The PDF files are searchable and printable but are not supplied as interactive, fillable AcroForm forms.
Format and digital delivery
Price SEK 79. Digital ZIP with 4 DOCX, 4 PDF, and 1 XLSX. No physical shipping. Automated customer delivery in Shopify assumes that the ZIP file has been correctly linked to the product variant in Digital Products.
Method sources
- OEE.com – Calculate OEE
- OEE.com – Availability, Performance, Quality
- Good Solutions – Vad är OEE och hur beräknas det?
Related documents
For forward-looking capacity planning: Production Planning & Capacity Calculator. For scheduled machine maintenance: Machine Register & Preventive Maintenance. For preventive process risks: FMEA – Failure Mode and Effects Analysis.
Disclaimer: This is a general documentation and calculation tool, not a safety certification, site inspection, or guarantee of production, work environment, or quality requirements. Adapt the measurement method and usage to your operation's actual conditions.